MainPage:Nuclear:Summer2014:PMTCharacterization
Abstract
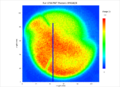
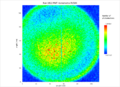
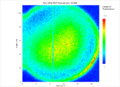
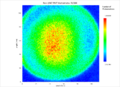
The purpose of this project is to characterize large-diameter photomultiplier tubes (PMT) through scans along the surface of the PMT with a low-intensity, focused LED, thereby creating a plot of the surface area of the PMT with the gain at each section. Scanned PMTs can be better used in other testing because more is known about the gain across the entire front face, and thus if only a few photons need to be detected by the PMT, it can be better setup to detect those small amounts of light by positioning a spot with a higher gain in front of the source. The method of scanning said PMTs consists of a two axis step motor moving an LED light source on a 100 x 100 grid opposite the face of the PMT, with 30 pulses of light from the LED at each step. The step motor receives 450 steps at a step length of 0.0025 mm, resulting in a scan resolution of 1.2 mm. Scans conducted in this manner have a high enough resolution to pick up most sensitive/non-sensitive spots on a PMT including the three supports along the side of the PMT which support the dynodes and other components inside the PMT. While this method of scanning PMTs has been conducted in the past, including at The Catholic University of America, the current scanning method will be used to characterize a PMT from the University of Virginia.
Photomultiplier Tubes (PMTs)
Photomultipler tubes are vacuum-tight light detectors compromised of a a photo-cathode face, multiple dynodes, an anode, and a source of high voltage, all of which convert photons into a stream of electrons (current). The front-facing photo-cathode in the PMTs at Catholic University create a flow of electrons when struck by light due to the low work work function and the high voltage running through the system that allow for the photo electric effect to easily create a small amount of current when struck by photons. This current is then amplified through a series of dynodes which create an cascade of electrons that increases exponentially with an increase in the number of dynodes and linearly with an increase in their gain. Finally the anode collects the current of electrons and transmits it.
Materials and Methods
Characterization of the following PMTs:
- Photonis Model XP4500/B, Serial 09641
- Photonis Model XP4572/B/D1
- Hamamatsu R1250 - https://www.hamamatsu.com/us/en/R1250.html
- University of Virginia PMT - Hamamatsu R1584 - http://www.hamamatsu.com/us/en/R1584.html

Other materials
- LED (need specification)
- Two axis motor - http://www.velmex.com/bislide_model_display.asp?id=19http://www.velmex.com/bislide_model_display.asp?id=19
- High Voltage Power Supply
- Coda programming to translate signal from PMT
- Anti-Magnetic Shielding
- Dark box and black cloth
- Optical fiber
- PS Octal 300 mHz Discriminator model 708
- PS Quad gate generator model 794
- Lecroy 2249A channel ADC http://www.fnal.gov/projects/ckm/jlab/2249a-spec.htm
Results
XP4500/B 09641
1589
1594
1736, with correct base
1947


XP4572/B/D1
1597

1686
1691
1692
1696
1710
1719


R1584
1816

1817
1821
1822
1902
1947
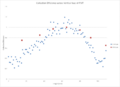
Comparison Graph


Analysis
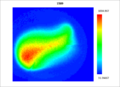
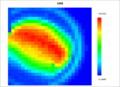
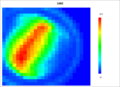
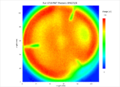
Results 1989 through 1692 were skewed by the fact that the base used for those scans did not work correctly (labelled 5B). Once replaced by a different base (labelled 101), the XP4572/B/D1 scan came out approximately the same as the scans that Marco conducted earlier this year. Therefore, the problems with the initial scans cam most likely be accredited to the fact that the 5B base was not working correctly, perhaps because of it did not distribute the voltage correctly across all channels of the PMT.
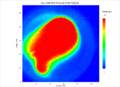
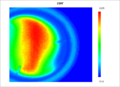
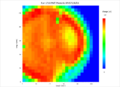
The Photonis XP4500/B PMT, even with the improved base, shows a large area of low gain in the topmost region. This could be some sort of deformity in the PMT itself or its also possible that it could be a problem with the scan since operator error did lead a large strip of the PMT to not be scanned. However, as this did not interfere with the area that showed low gain.
PMT Gain
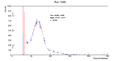
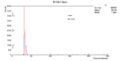
The gain of a PMT is calculated by shining an LED at the lens of the PMT at the minimum intensity needed to convert a photon into an electron from the photo cathode via the photo electric effect. At this intensity, some of the LED blinks will register as only background noise, and some will register as an amplified signal. By creating a histogram of this data, two peaks will appear. One, the pedestal, represents the background noise of the wires and other equipment, read even without a signal from the PMT. The other peak, which can be calculated by a Gaussian curve fit or through a mean calculation at two points on opposite ends of the peak, is the single electron peak, or the amplification of the signal of a single electron passing through the PMT.
Conclusion
Presentation
Calorimeter Model


Final Paper
Sources
Works Cited
© 2007 Hamamatsu Photonics K. K. "Photomultipler Tubes: Basics and Applications." (n.d.): n. pag. Web. <https://www.hamamatsu.com/resources/pdf/etd/PMT_handbook_v3aE.pdf>.
Hlavin, N. (n.d.). Kaon Aerogel Cherenkov. Washington, DC. Retrieved from http://www.jlab.org/Hall-C/talks/06_22_12/hlavin.pdf
Photomultiplier Tubes. Hicksville, NY: n.p., 1965. Web. <http://physics.csustan.edu/Ian/Spectroscopy/LectureNotes/Detectors/PMT.pdf>.