Difference between revisions of "MainPage:Nuclear:Summer2014:LEDSpectrum"
| Line 33: | Line 33: | ||
First, the light enters the collimator, which focuses and narrows the light rays by making them parallel to each other. The beam of light then hits a diffraction grating, which diffracts the light into different beams, depending on the wavelengths of the light. The slit in the spectrometer allows only one specific wavelength through to the detector. The detector determines the voltage of the wave, which is amplified with an op amp and displayed on the voltmeter. | First, the light enters the collimator, which focuses and narrows the light rays by making them parallel to each other. The beam of light then hits a diffraction grating, which diffracts the light into different beams, depending on the wavelengths of the light. The slit in the spectrometer allows only one specific wavelength through to the detector. The detector determines the voltage of the wave, which is amplified with an op amp and displayed on the voltmeter. | ||
| + | |||
| + | |||
| + | |||
| + | |||
Revision as of 14:55, 21 July 2014
Abstract
Light-Emitting Diodes have a multitude of uses due to their increasing efficiency, long life, reliability, durability, and practical size. As the uses for LEDs widen, there is a greater need to precisely know their optical characteristics. Therefore, this project aims to determine the spectrum of Light-Emitting Diodes and the relationship between wavelength and light intensity. To record the spectra of the various LEDs present in the lab, a spectrometer must be constructed. A power source will be attached to the LED so that it may convert electrical energy into light. After the light is converted into a more precise beam by a collimator, it will be separated into various wavelengths (or colors) by the diffraction grating. A slit will then limit which wavelength of light may be detected and amplified so that the voltage and thus intensity of the light may be recorded.
Light-Emitting Diodes
Background
Light-Emitting Diodes, or LEDs, were first developed by Nick Holonyak Jr. in 1962. LEDs are a type of semiconductors that convert electrical energy into light. LEDs are relatively efficient and have surpassed incandescents and will soon surpass fluorescents, due to the creation the high-power white LED. LEDs are durable and reliable. While incandescent bulbs convert only about 5% of their power into light, LEDs convert about 15 to 20% pf their power into light, making them much more efficient. Since we believe LEDs will become 10 time more efficient than incandescent bulbs, they promise to provide a source for general lighting in the near future. If LEDs are to be used on such a broad scale in the future, it is vital that more information on the optical characteristics be recorded.
The first high-brightness blue LED was demonstrated rather recently, simply in 1994, and led to the creation of the white LED. Development in the creation of LEDs causes efficiency and light output to double about every three years since the 1960s. Plus, it has led to advancements in other semiconductor technologies and optics. The popularity of LEDs is also increasing due to new methods being discovered that would reduce the production costs by tremendous amounts.
How they Work
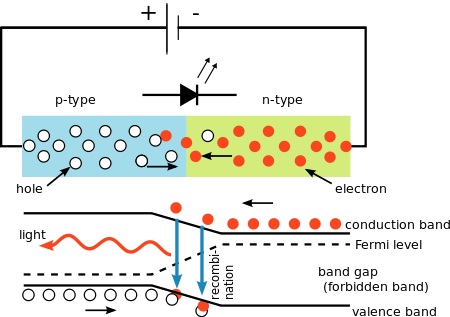
An LED is a semiconductor with a p-n junction. Current flows from the anode or p-side of the diode to the cathode or n-side. When an electron and a hole meet, the electron travels to a lower energy level and releases a photon and thus emitting light. The color or wavelength of the light emitted varies based on the band gap energy of the material. LEDs are created of material with a direct band gap and thus the energies correspond to near-infrared, visible, or near-ultraviolet light.
Why are they important?
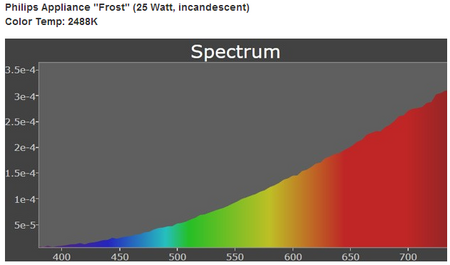
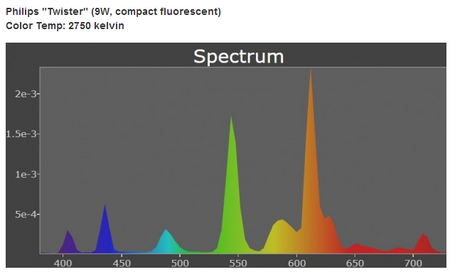
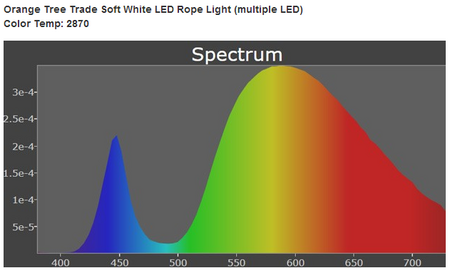
LEDs have nominal wavelengths. They generally emit simply one, precise wavelength (unlike other light sources). Below are photos showcasing the differences between the wavelengths emitted by LEDs as compared to incandescent and fluorescent bulbs.
Spectrometers
Spectrometers are instruments used to measure properties of light, by separating the light into its spectral components, and then measuring light intensity or wavelength. The basic components of a spectrometer, also known as a spectrophotometer, are a light source, a collimator, a diffraction grating, a slit, and a detector. Some spectrometers have computers or other devices which analyze the data from the detector and determine radiation intensity as a function of wavelength.
First, the light enters the collimator, which focuses and narrows the light rays by making them parallel to each other. The beam of light then hits a diffraction grating, which diffracts the light into different beams, depending on the wavelengths of the light. The slit in the spectrometer allows only one specific wavelength through to the detector. The detector determines the voltage of the wave, which is amplified with an op amp and displayed on the voltmeter.
Collimator
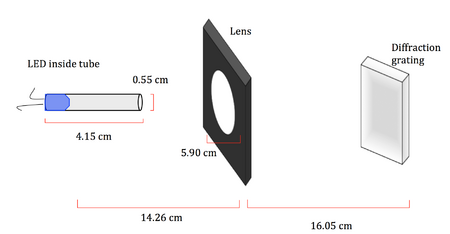
After trying several different designs (i.e. with lens, without lens, different tube lengths, etc)we found that using a short metal tube and a convex lens resulted in the most intense and precise beam of light.
Diffraction Grating
In this experiment, a blazed grating will be used.
The equation we will use to find the wavelength of the LED light: d(sinθ) = mλ, where θ is the angle of diffraction, m is a positive or negative integer, d is the separation of grating elements, and λ is the wavelength, or the unknown. For our specific diffraction grating, d= 1/1200 grooves per mm.
Amplifier
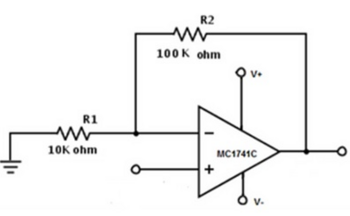
A circuit was created to amplify the voltage detected. Below are the schematics for the circuit which has a gain of 10 when an input voltage in the millivolts is provided. Resistors with values in the thousands of ohms were used because the larger resistor values resulted in less fluctuation when measuring the output voltages. The op amp used was a Motorola mc1741cp1. Fifteen volts of power were used to power the op amp and result in a working circuit. Also displayed below is a graph depicting the characteristics of the amplifier. As the resultant voltages from the LED light appear to be from about 50 - 150 millivolts, the test of the amplifier focused on the aforementioned region.
Luminous Intensity
Once the detector and amplifier identify the voltage of each wavelength, we will calculate luminous intensity by first calculating the power. Then, we will convert power into luminous flux and consequently be able to find the luminous intensity.
The equations for that process are:
Φ = P × η
I = Φ / Ω
Where Φ is luminous flux (lumens), P is power (watts), η is luminous efficacy (lumens/Watt), I is luminous intensity (candelas), and Ω is solid angle (steradians)
Iv(cd) = (I(A) V(V)η(lm/W)) / Ω(sr)
Materials and Methods
Convex Lens Glass, 5.90 cm diameter
Metal Rod 0.55 cm diameter
DC Power Supply (two)
Function Generator/AC Power Supply (one)
Cardboard Boxes
Black Spray Paint
Black Duck Tape
Resistors One 10 k and one 100 k resistor
Op Amp Motorola mc1741cp1 (the datasheet may be found here: http://pdf.datasheetcatalog.com/datasheet/motorola/MC1741CD.pdf)
Breadboard
Wire
Thorlabs Blazed Diffraction Grating http://www.thorlabs.com/newgrouppage9.cfm?objectgroup_id=26&pn=GR50-1204#3743
Thorlabs High-Speed Photodetectors http://www.thorlabs.com/newgrouppage9.cfm?objectgroup_id=1295
Styrofoam To create holders for LED, lens, detector, and diffraction grating
Results
Analysis
Conclusion
Sources
"Build a Spectrometer!" University of Colorado Boulder, n.d. Web. 3 July 2014. <http://www.colorado.edu/physics/phys3340/phys3340_sp14/CourseInformation/Optics/Build%20a%20spectrometer%20v2.pdf>.
"High Speed Photodetectors." Detectors. Thorlabs, n.d. Web. 3 July 2014. <http://www.thorlabs.com/newgrouppage9.cfm?objectgroup_id=1295>.
"Holograph Gratings, Reflective." Optical Elements. Thorlabs, n.d. Web. 3 July 2014. <http://www.thorlabs.com/NewGroupPage9.cfm?ObjectGroup_ID=25>.
"The Radiometry of Light Emitting Diodes." Labsphere. Labsphere, Inc., n.d. Web. 3 July 2014. <http://www.labsphere.com/uploads/technical-guides/The%20Radiometry%20of%20Light%20Emitting%20Diodes%20-%20LEDs.pdf>.
"Ruled Diffraction Gratings, Reflective." Optical Elements. Thorlabs, n.d. Web. 3 July 2014. <http://www.thorlabs.com/newgrouppage9.cfm?objectgroup_id=26&pn=GR50-1204#3743>.
Tavener, Stewart J., and Jane E. Thomas-Oates. "Build Your Own Spectrophotometer." Royal Society of Chemistry. N.p., Sept. 2007. Web. 3 July 2014. <http://www.rsc.org/images/EiC-05_2007-spectrophotometer_tcm18-214788.pdf>.
"Things You Should Know about LEDs." University of Nevada Los Vegas Department of Physics and Astronomy. University of Nevada Los Vegas, n.d. Web. 3 July 2014. <http://www.physics.unlv.edu/~bill/PHYS483/LED_PIN.pdf>.
Saeedifard, Maryam. "Introduction to Light Emitting Diodes (LEDs)." College of Engineering, Purdue University. Purdue University, n.d. Web. 7 July 2014. <https://engineering.purdue.edu/~ece495/Power_Electronics_Lab/LED_Basics.pdf>.
"Photometer and Optical Link." Department of Physics, University of Colorado Boulder. University of Colorado Boulder, n.d. Web. 7 July 2014. <http://www.colorado.edu/physics/phys3340/phys3340_sp07/CourseInformation/Electronics/Exp_6.pdf>.
Scalise, Randall J. "Diffraction Grading." SMU Physics Electricity and Magnetism Laboratory Manual. SMU Dedman College of Humanities and Sciences, n.d. Web. 7 July 2014. <http://www.physics.smu.edu/~scalise/emmanual/diffraction/lab.html>.
"Wavelengths of Line Spectra and the Diffraction Grating." Launceston College - Physics. Launceston College, n.d. Web. 07 July 2014. <http://www.launc.tased.edu.au/online/sciences/physics/diffra/diffrac.htm>.
